Admin-Scout 1.4.4 - the new dashboard, an overview
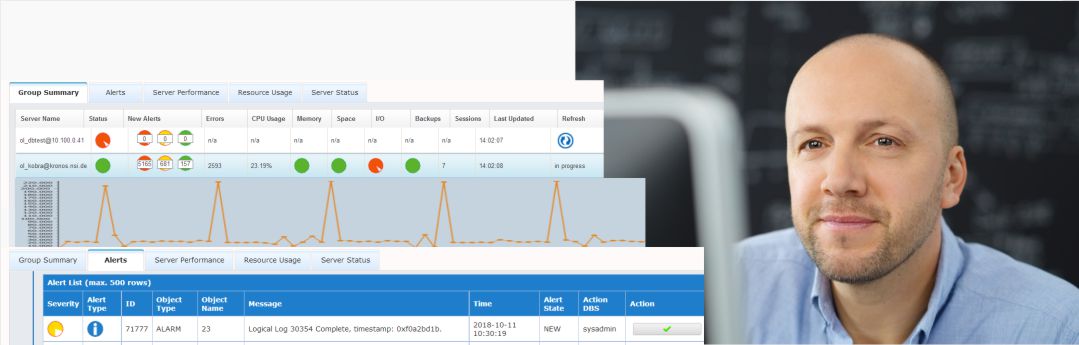 The Admins-Scout Dashboard is an extremely powerful and informative tool that gives you an overview of the state of your Informix servers
- The Admin-Scout Dashboard is the central overview for important parameters and states.
All Informix servers in a group are listed and the status of a server is displayed with icons.
- The details of an instance are very useful for troubleshooting or for identifying optimization potentials. For example, it is very easy to find tables where indexes are missing or the index structure is not ideal.
- In contrast to the OAT, the Admin-Scout offers the possibility to switch between the tabs - without waiting times and without having to start the reporting from the beginning.
This article describes the Admin-Scout Dashboard and its individual sections.
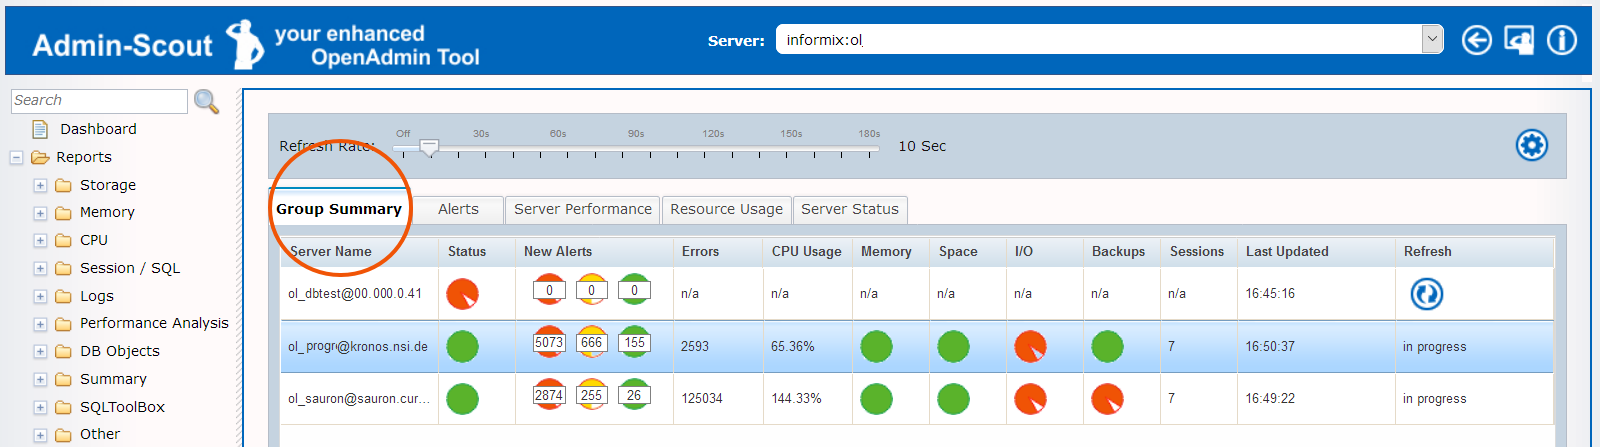
Group Summary
- Below the |Group Summary| tab, directly next to the "Server Name" column, it is displayed whether an instance is online, or in the other columns whether it has errors or warnings in the essential parameters. Further details on the entries in the columns for Memory, Spaces, IO and Backup can be accessed via the tab |Server Status|.
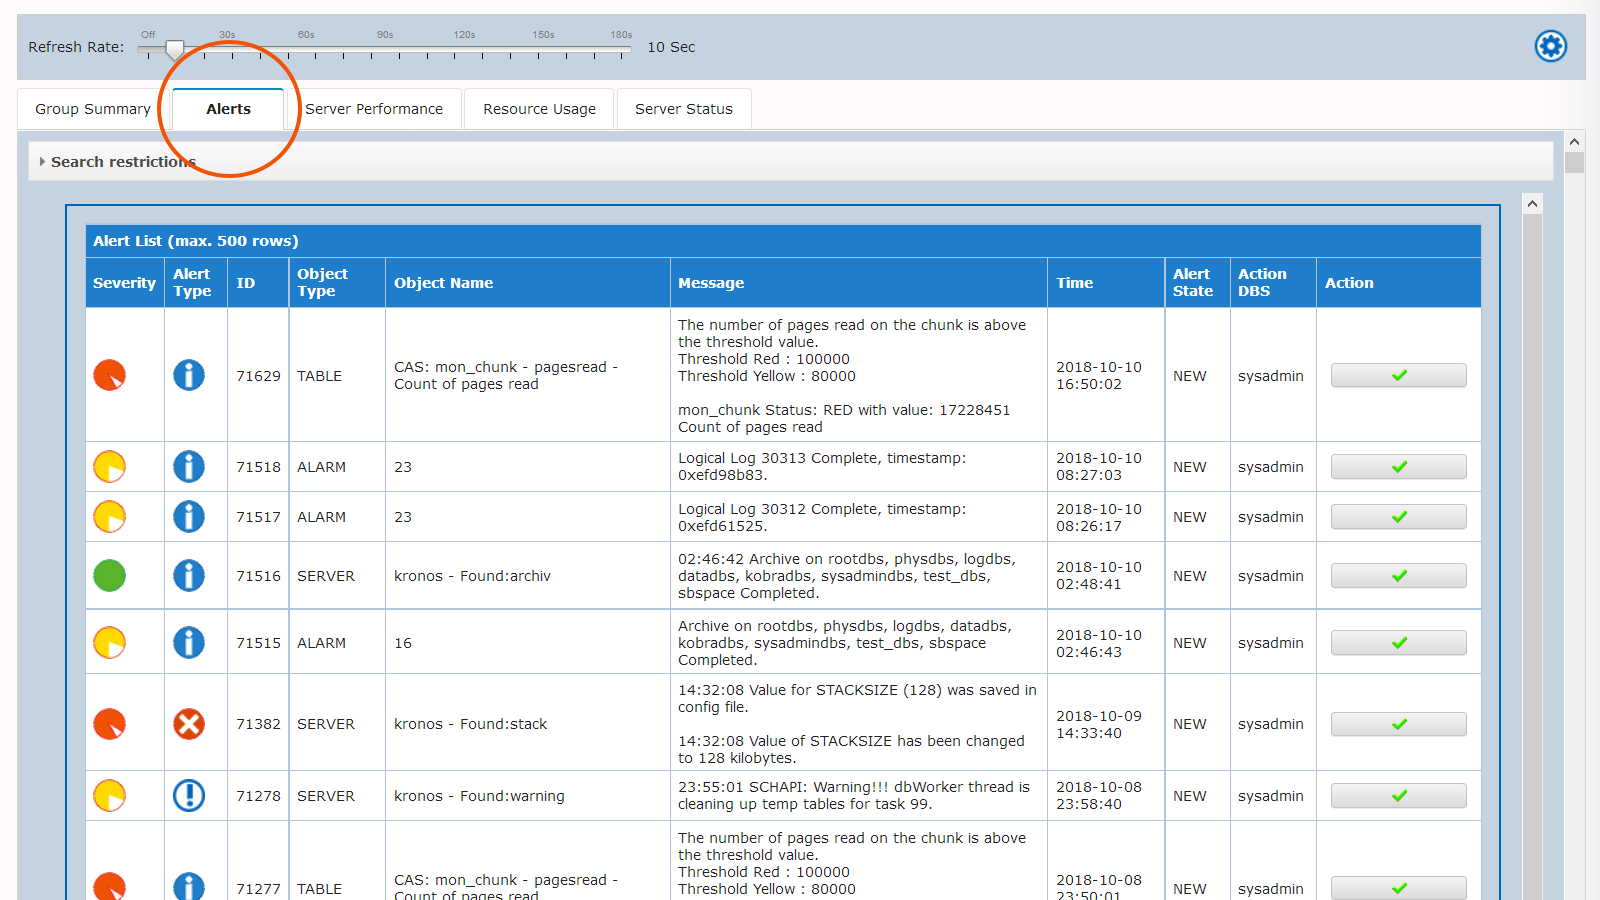
Alerts
- The alarms displayed in the |Group Summary| tab can be viewed in more detail via the |Alerts| tab.
- The messages displayed are generated from the Informix alarm program. All defined threshold values and sensor evaluations are also included here.
- With the Admin-Scout, CURSOR delivers a large number of useful threshold values. The preassignment, with empirical values from CURSOR support, shortens and simplifies the start-up.
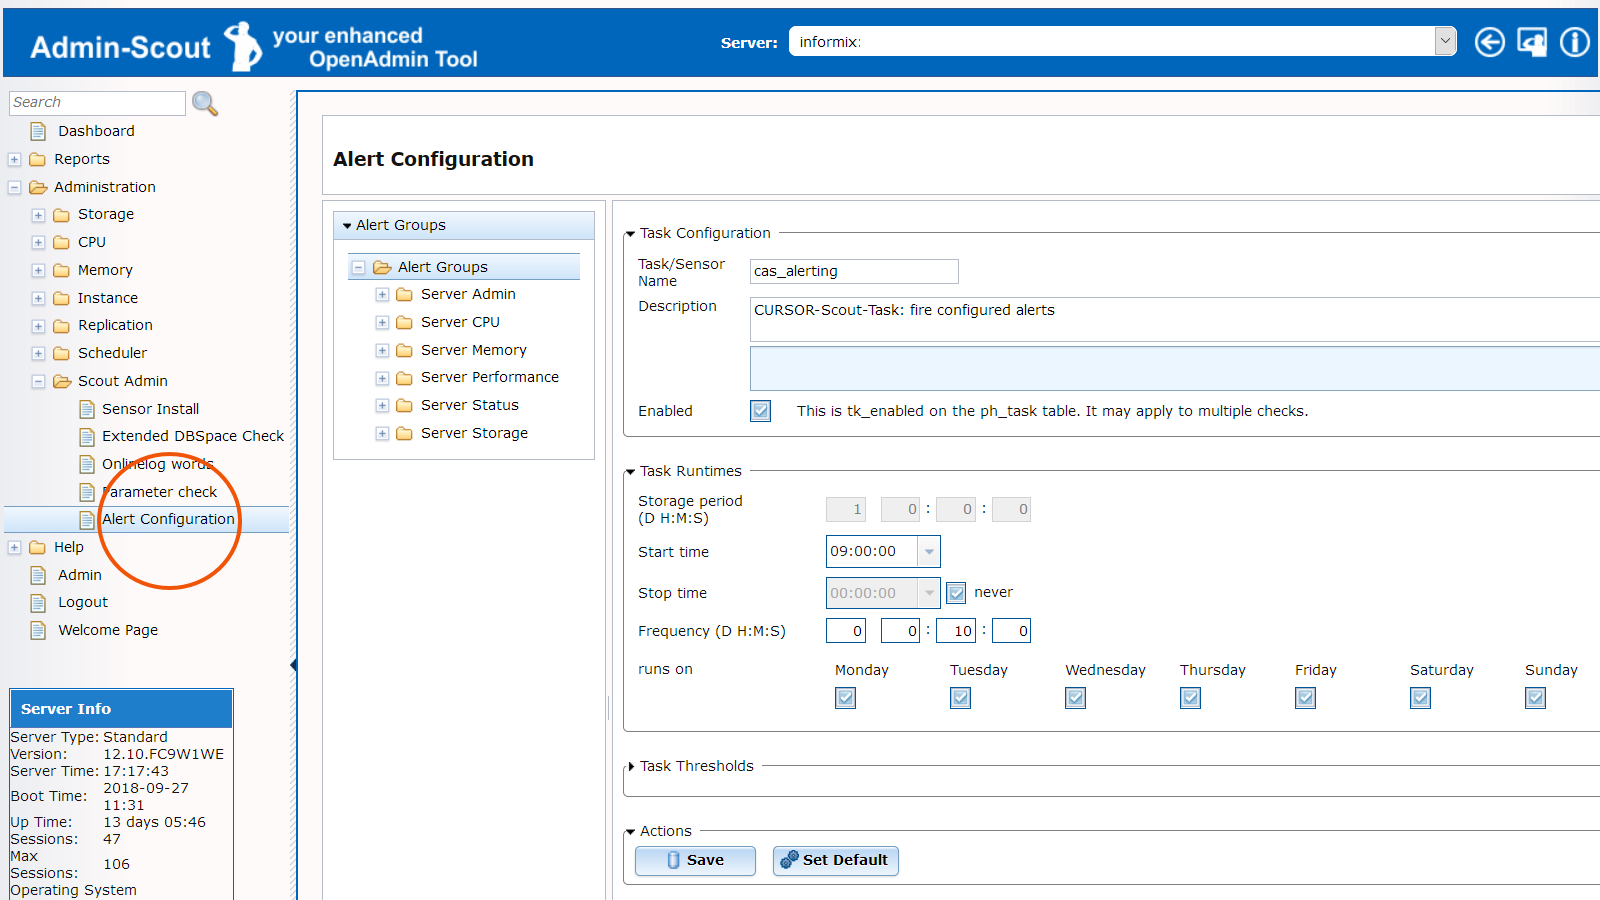
Alerts - Configuration
- The finely graduated configuration of the alarms is carried out via the menu item "Alert Configuration". Details on the configuration are described in a separate blog entry.
Alerts - Search Restrictions
- The "Search Restrictions" can be defined directly under the |Alerts| tab. By default, the Alert Type is set to "Warning + Error", the Alert Color to "Red + Yellow" and the Alter State to "NEW".
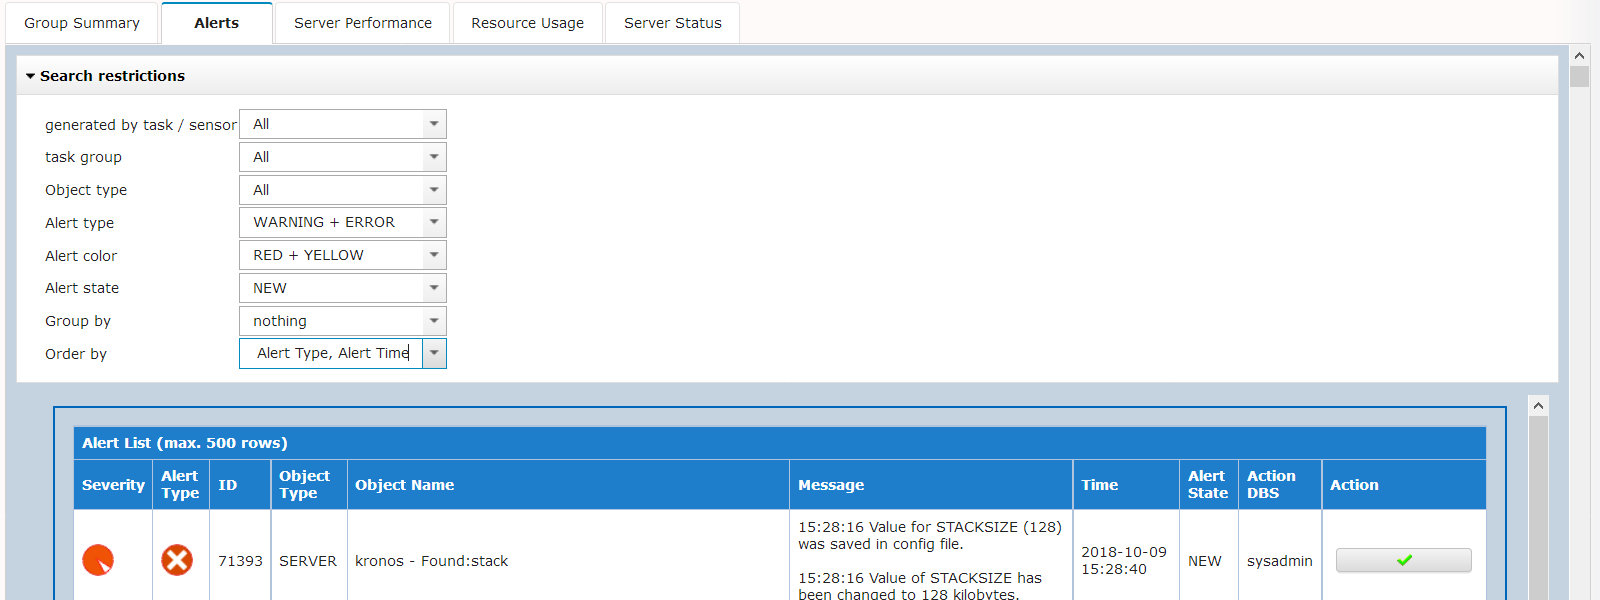

- Each entry in the "Alert List" has a traffic light control according to its meaning. The assignment to the traffic light colors can also be fine-tuned in the alert configuration.
- This is especially useful if you only want to be notified about events that are really important. Pure information messages can be marked green, so that only one entry can be found in the dashboard and in the "Day-Report" on the following day.
- The button behind each alarm can be used to mark it as processed. After a click on the green icon the alarm disappears from the standard overview. Via the "Search Restrictions", all alarms and warnings registered in the system can be returned to the overview at any time.
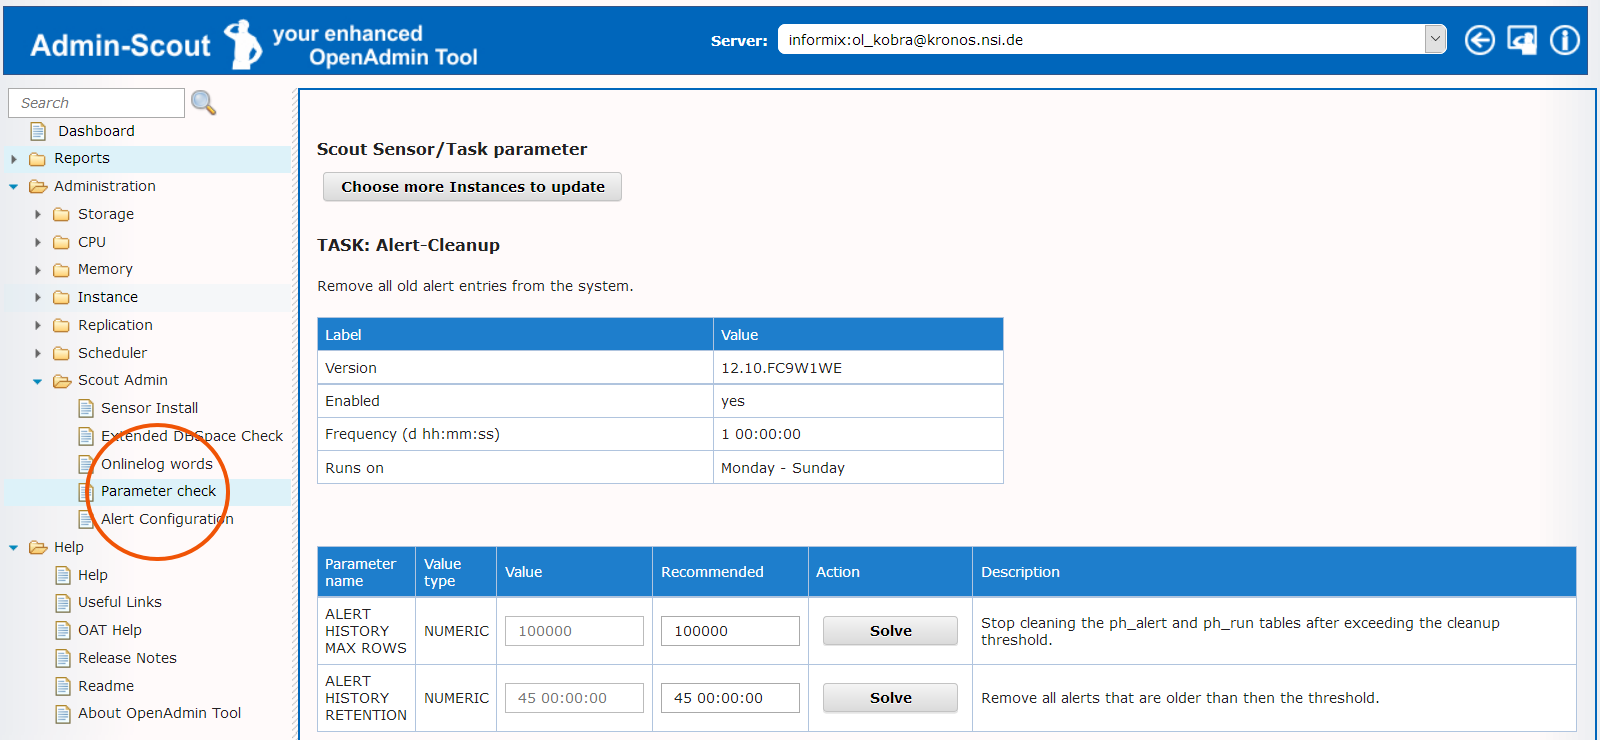
Alerts - Parameter Check
- The Admin-Scout stores alarms and warnings. How long these messages should be stored can be defined via the menu item "Parameter Check". We give here 45 days, the value can be adapted as required.
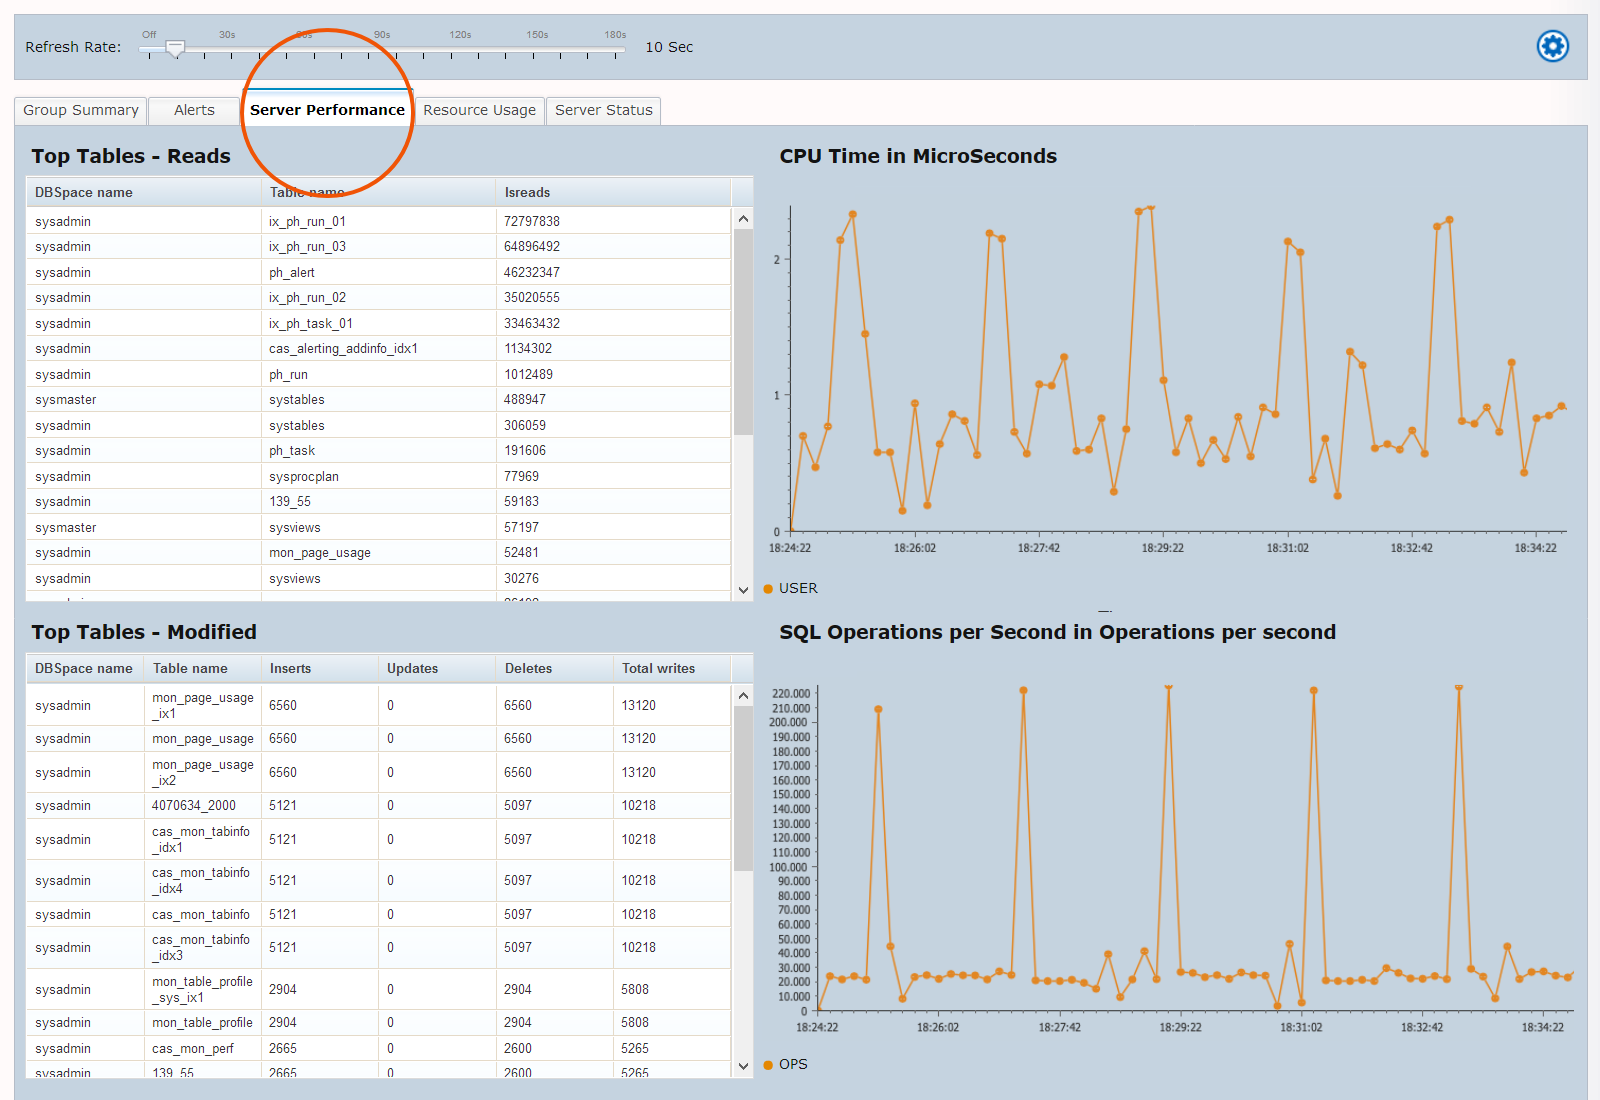
Server Performance
- The tab |Server Performance| is a live view of performance-relevant measurements for the selected instance. The standard view lists the most important I/O-relevant tables, as well as the CPU time and the number of SQL operations per second. However, the SQL operations should not be confused with the number of SQL statements, but contain the much finer explanations that are necessary to process an SQL statement (I/O, sort, join, etc.).
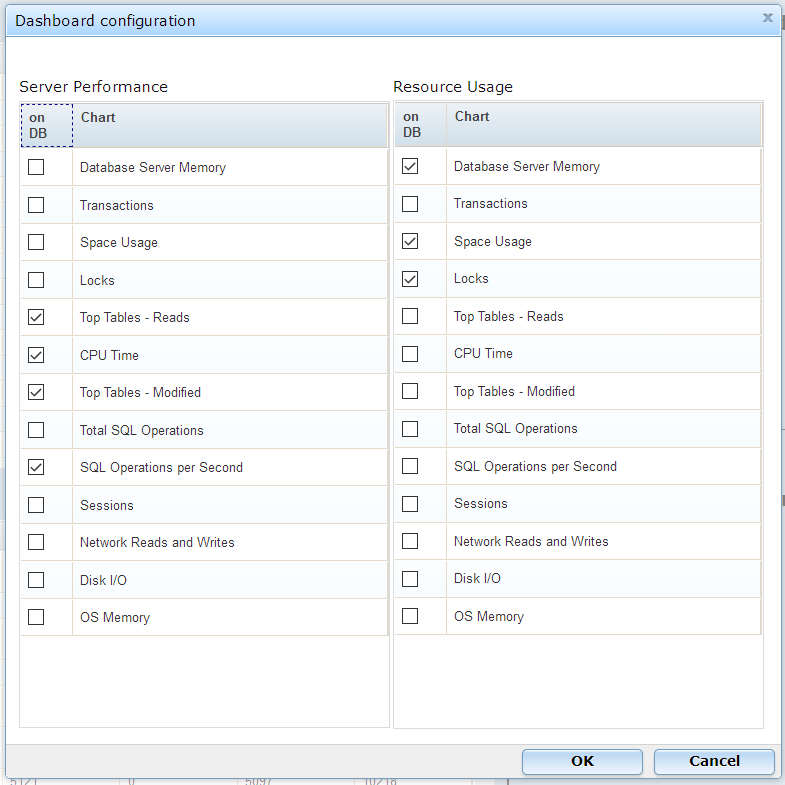
- The selection of the displayed panels can be easily adjusted. The configuration button at the top right opens a form with the possible entries.
- The "Dashboard Configuartion" form is used to select the panels for the |Server Performance| and |Resource Usage| tabs. A maximum of four panels can be selected and displayed per tab.
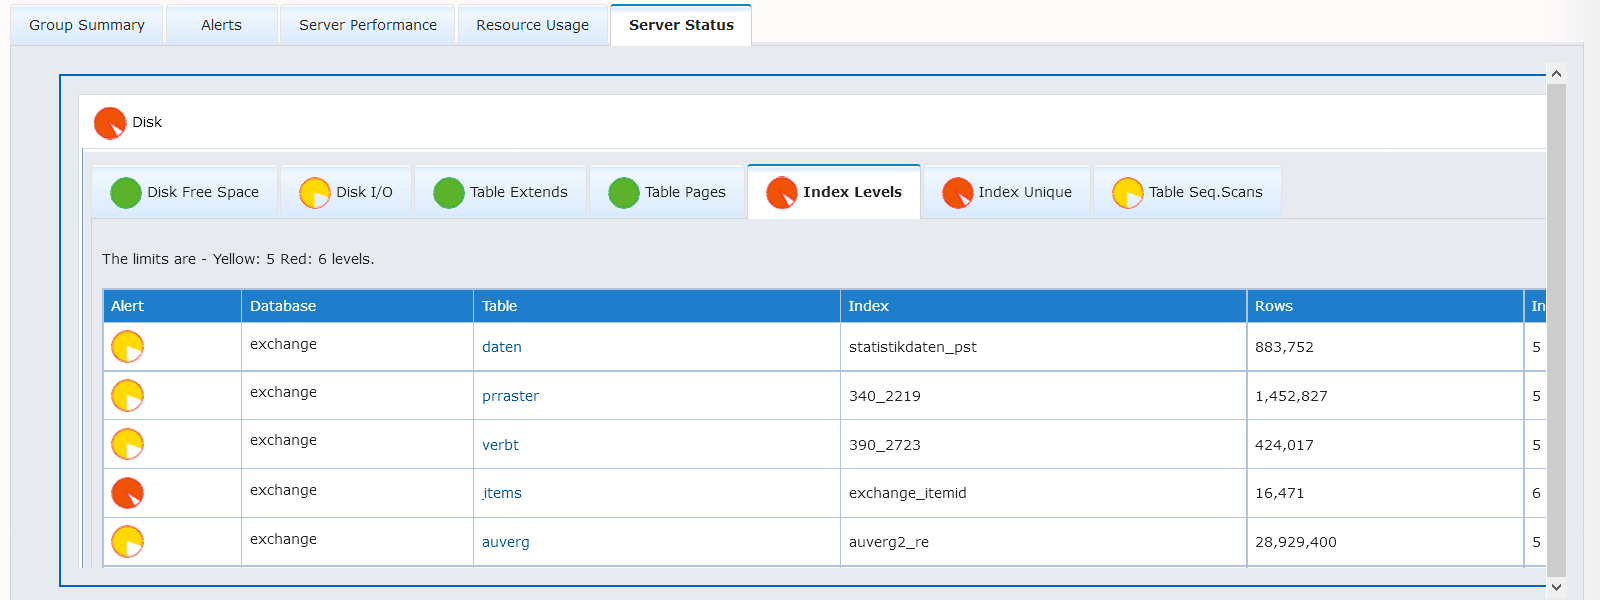
Server Status
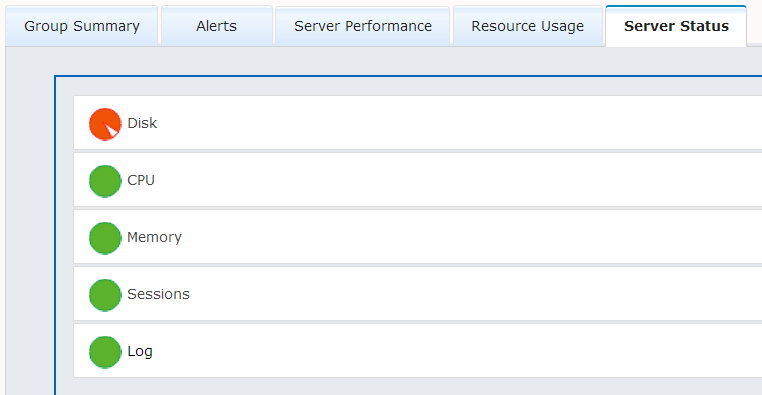
- The last tab offers evaluations of the server status.
- Via |Server Status| details in the respective areas can be retrieved. As here in the Disc / Index Levels area.
- The evaluations and the traffic light control were preset according to the experiences made in CURSOR Informix Support.