Admin-Scout 1.4.4 - DBSpaces and Storage Report
 An Admin-Scout feature for fast analysis of DBSpaces
- DBSpaces - key data and workload at a glance
- shows access, page I/O, read and write times
- view details down to single a database
- drill-down information down to chunk level
- DBSpace history data for storage planning
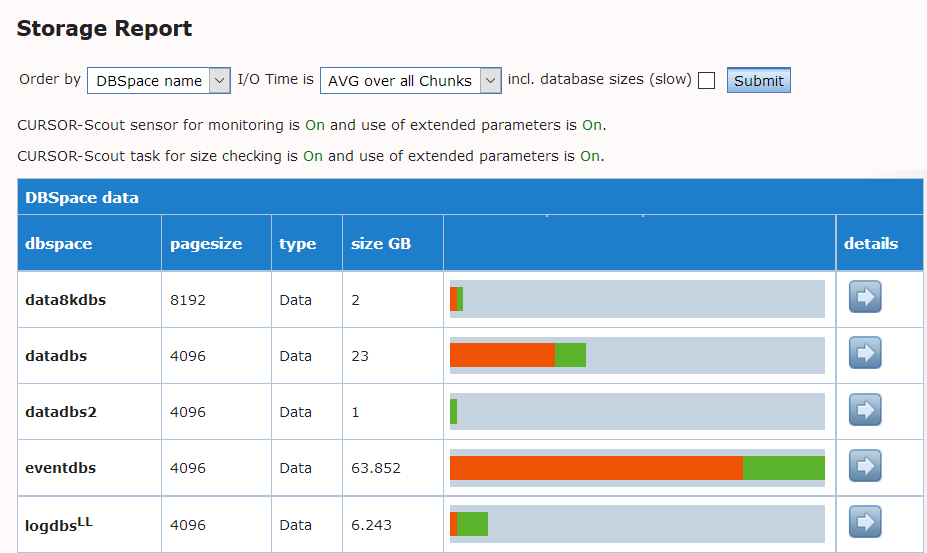
- The Admin-Scout Storage Report provides a basic overview of all DBSpaces.
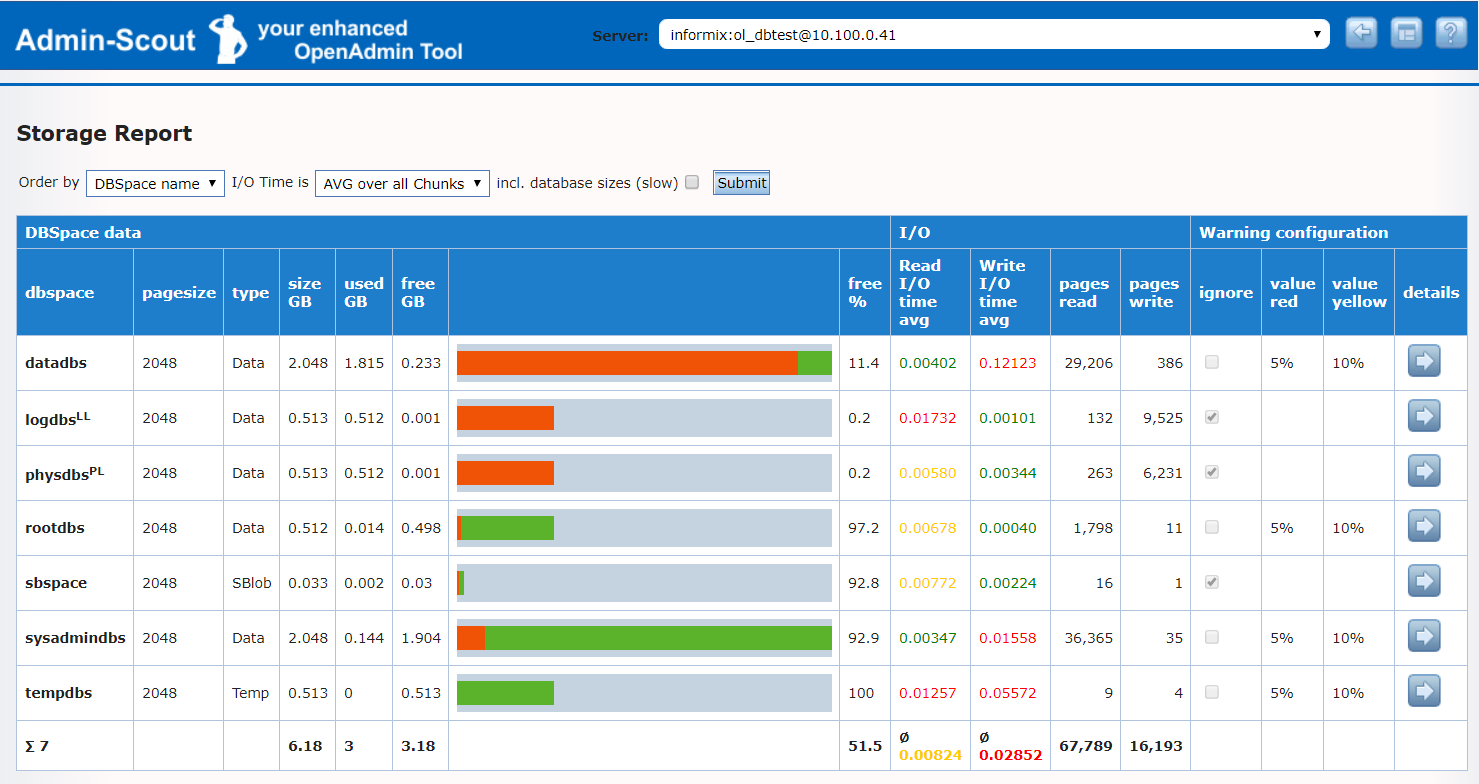
Overall, the report contains a large number of evaluations. The DBSpaces and the corresponding pagesizes are listed. The overview shows the size of the DBSpace, which consolidates used and free memory. This is particularly useful if a DBSpace has a large number of chunks that would otherwise have to be calculated manually using onstat -d.
Information about I/O can be found on the right side of the bar chart. There you can see which DBSpaces have the most traffic. In the Warnig configuration the threshold values are displayed, over which an alarm is generated if the value falls below the defined free memory size.
These threshold values can be configured in the scout settings under "DBSpace Check Parameters". The advantage here is that we can define individual threshold values for each DBSpace. Otherwise a physdbs or logdbs, which is used completely, would generate an alarm after each evaluation. In the configuration these DBSpaces can be set to "ignored".
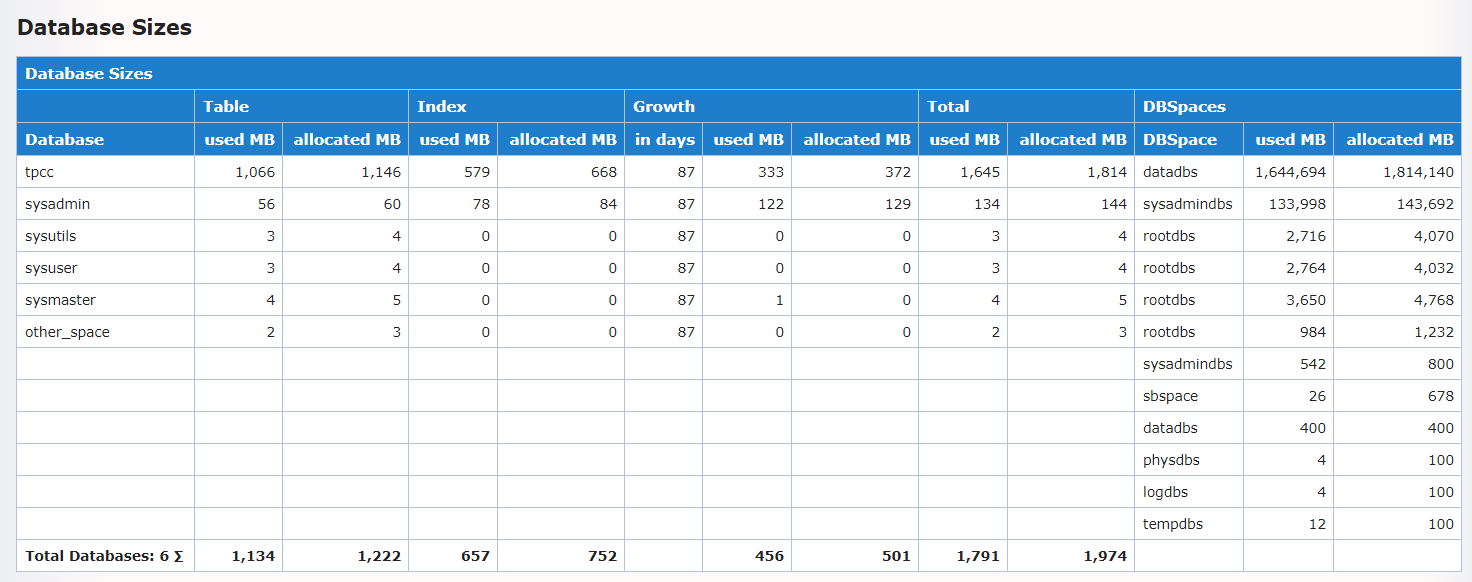
- Optionally, the evaluation can be extended to the databases located in the DBSpaces. This evaluation shows not only the sizes of the databases, but also in which DBSpaces DB objects are stored.
 Drill-Down
Using the last column of the overview, it is possible to access the detail level of a DBSpace.
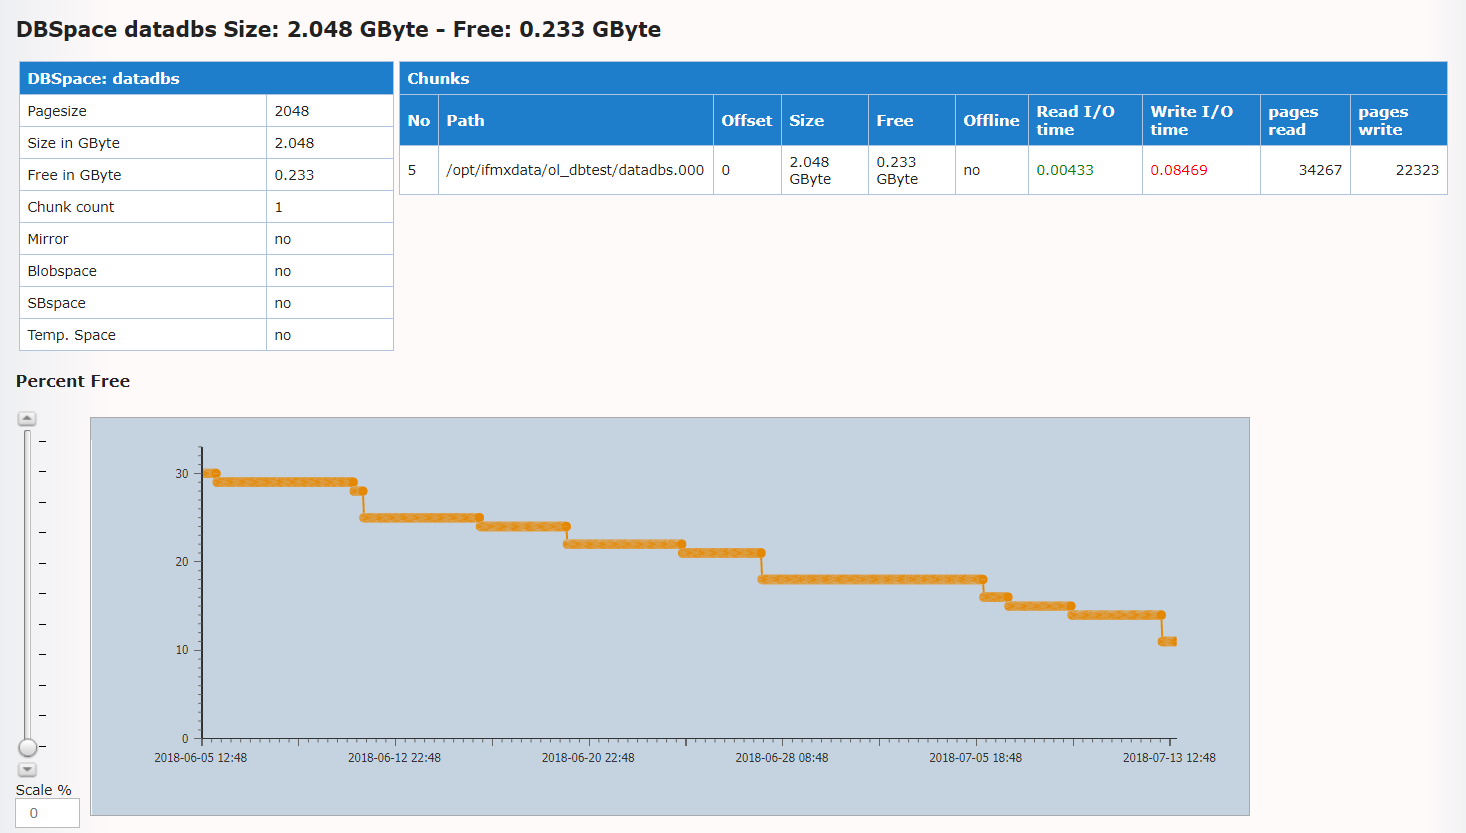
- Here all associated chunks are displayed and also the information about the available memory or I/O is broken down. With a large number of chunks, a possible I/O problem can be identified here if, for example, a chunk turns red in the reading or writing area and the specific path can thus be identified.
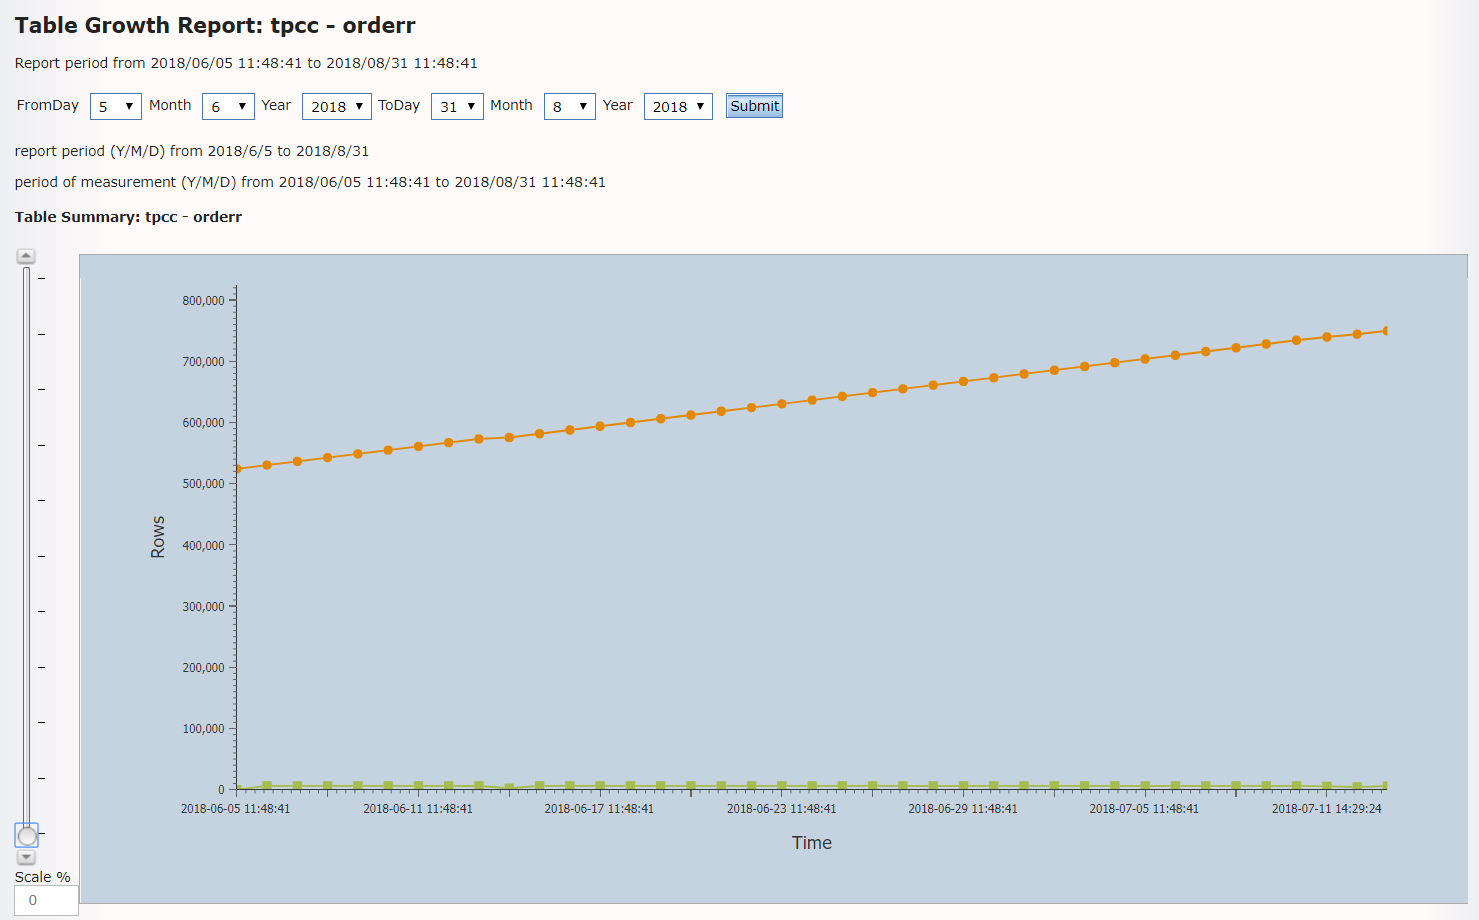
- Depending on the settings, the growth of the DBSpace can be output here over the "Storage Period" defined in the configuration. This is especially helpful for a clean planning of the storage.
- All tables and indexes that can be found in this DBspace are listed in the course of the detailed view. If a table has requested a new extent in the last 14 days, this is displayed with date and in red.
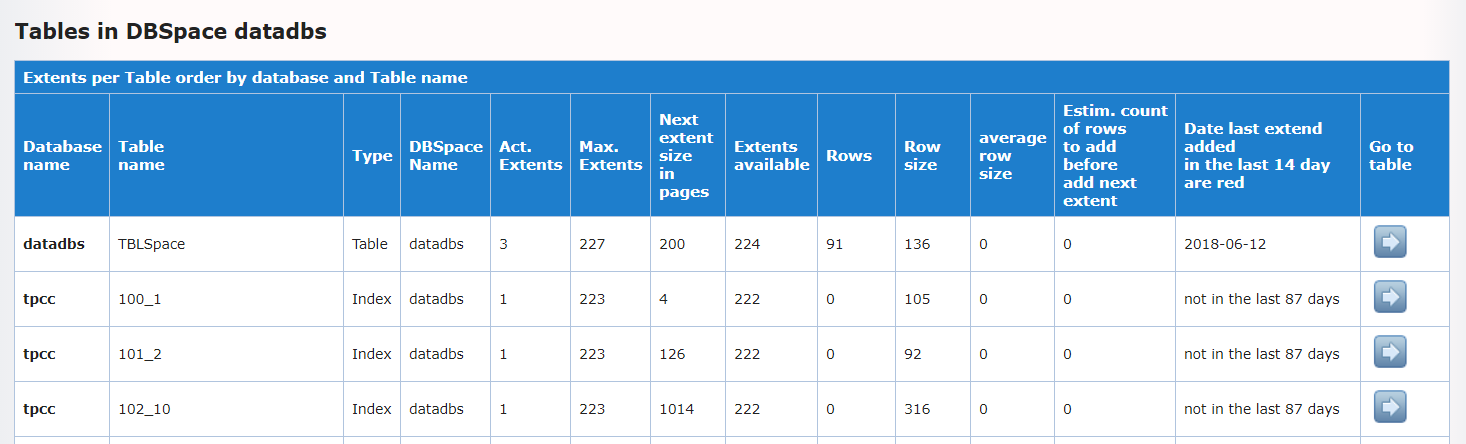
- You can then drill down to the detailed display of the tables. Here you can see the growth history of the selected table.